Grade 3 Math SOL Worksheet: Probability and Statistics

Pictographs, Bar Graphs and Tally Charts
Make data and graphing fun for 3rd graders with this free printable math worksheet focused on pictographs, bar graphs, and tally charts! Designed to help students collect, organize, and analyze real-world data, this engaging resource builds foundational skills in statistics and probability.
Students will learn how to read and create graphs, draw conclusions from data, and solve problems using addition and subtraction — all aligned with Virginia SOL standards. Ideal for classroom instruction, homework, or enrichment at home!
This worksheet is aligned with VA SOL standards 3.PS.1. And here is a link to a Just-In-Time check (VA SOL 2016 standards) for common misconceptions.
Download here
Skills Covered
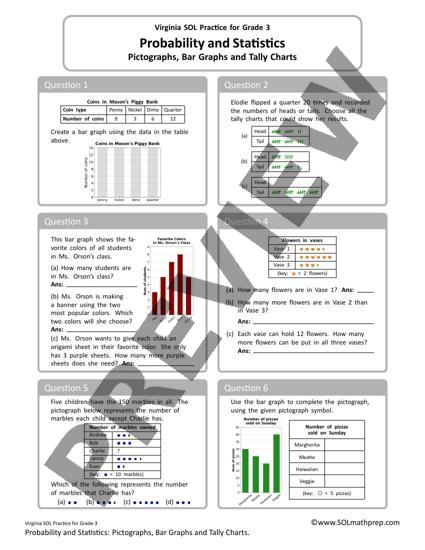
- Q1: (3.PS.1(d)) Create bar graphs given tabular data.
- Q2: (3.PS.1(b)) Interpret tally charts.
- Q3: (3.PS.1(b, e)) Make inference using data represented in pictographs.
- Q4: (3.PS.1(b, e)) Make inference using data represented in bar graphs.
- Q5: (3.PS.1(b, c, e)) Interpret pictographs using the given key, and create new representation.
- Q6: (3.PS.1(c)) Use a bar graph to create an equivalent pictograph.